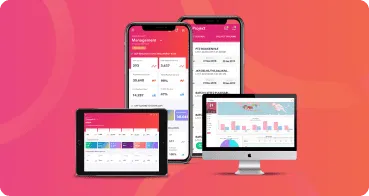
Still bothered by making various project management tools such as Gantt Chart and S Curve manually? Relax, now you can make it quickly and easily through the right app.
We usually need a variety of tools to manage a project. These various tools will be useful to help you plan, schedule, monitor progress, to see a comparison of plans and realizations in the field. Of the many tools commonly used in the world of project management, Gantt Chart and S Curve are some of the most popular.
Unfortunately, the making process of Gantt Chart and S Curve is currently still done manually. So, imagine when you are tired after monitoring project completion in the field, you still have to be faced with calculations and data analysis that is not small to make it. In fact, you can take the time to make this manual report to focus on project operations to make it better. Then, how to?
TOMPS Gantt Chart Feature
Gantt Chart, also known as the Milestones Chart and Project Bar Chart, is a type of bar chart that is widely used for project monitoring. Gantt Chart contains information like team member assignments, schedules, and project implementation deadlines. Not only that, you can also see which party or division is responsible for a task in the project. Through Gantt Chart, project managers and stakeholders can see the effectiveness of project progress.
With Tomps Project Management System, it will be easy for you to create a Gantt Chart. Tomps system will record the following activity bar with the date and duration of its completion. This Gantt Chart will be formed automatically in the Tomps reporting feature that always moving depend on progress project completion. So, every “up-date” button-click that team does for each task, then at the same time Gantt Chart’s graphic is formed for you.
TOMPS S Curve Feature
“What is the S Curve?”. S Curve is one of the most popular calculation methods used in construction projects. In project management terms, S Curve is a mathematical graph that represents the cumulative data of a project. Such as the cost or duration of work time (man-hours) that have been used, or the percentage (%) of completion.
In general use, S Curve is used to measure the progress of project work, evaluate performance, and as a consideration for making cash flow estimates. S Curve is widely used because it is able to display real-time cumulative data from various project elements and compare it with projected data. In a business climate that prioritizes the value of speed, project work must be carried out and completed according to a predetermined schedule and budget.
The reporting feature in Tomps also provides an S Curve report that you can take advantage of. The nice thing is that you no longer need to take into account weight division and work time manually. Yes, Tomps S Curve feature will be formed automatically following every “up-date” click made by the team when updating their work status. In Tomps S Curve, you can see a comparison of the realization and planning graphs, details of activities, weights, duration of completion, to the specific time of execution. So, you can see and use S Curve information easily and quickly!
Tomps All In One Project Management Apps
It doesn’t stop there, Tomps as a professional project management application is also equipped with various features to manage projects end-to-end. Starting from the initiation stage to closing. Some of the interesting features that you can experience are:
☑️ Project Scheduling, Planner, and Completion
☑️ Project Tracking
☑️ Project Cost
☑️ Project Appraisal
☑️ Document & Evidence Repository
☑️ Unlimited Cloud
☑️ Role Access Management
☑️ Vendors Performance Report
☑️ Automatic Project Reports
☑️ Gantt Chart & S-Curve
☑️ Geo-Map Tagging & Visualization
☑️ API Integration
☑️ Customization-Friendly
Interested in trying Tomps construction project management software for FREE?


